Limiting Skin Friction (T-Z) for Sand.
The example highlights the parameter FMax specified for Sand under the command API_SOIL. (The new option will be available in Version 8-2). By default , the skin friction increases for increasing overburden pressure, but the user may override this by specifying a maximum , limiting skin friction.
In the actual example, the P-Y, T-Z and Q-Z properties of each layer are computed according to API-93 based on the user defined soil data (like friction angle, weight, shear strength etc.). For the upper layers, a weak sand is specified with the skin friction limited to 20.000 N/m2 (20 kPa). The lower layers are specified with a stronger sand, and in this case, the skin friction resistance is limited to 50.000 N/m2 (50 kPa).
Same property could be referred to several time, and reference to 0 gives no soil stiffness at actual layer.
The actual parameter FMax is specified as the last parameter as seen below.
' ID typ load Gam Plug Phi Delta rNq QPlim FMax
API_SOIL 11 Sand Static 17000 0 25 25 20 1.0E+07 20E3
The simple "structure" is defined in the model file, while the Pile/Soil data are specified in the Control file.
=> Usfos Control File
=> Model File
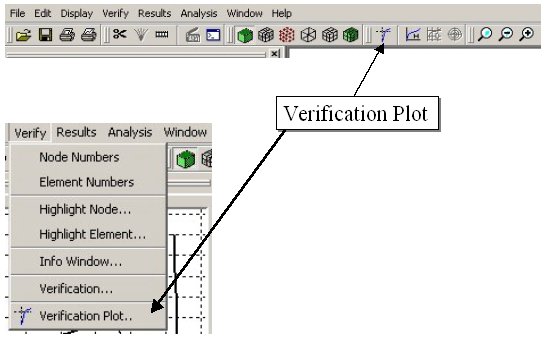
The pile and soil forces and capacities are visualized in the Graphical User Interface using the "Verification Plot", (see Figure 1).
Figure 1 Verification Plot is found under "Verify" and on the "Main Menu Bar".
The Verification of piles are grouped in:
The actual pile is selected by pressing the "Target Button" and Point on the actual pile (Ctrl + Left Mouse button).
The degrees of freedom are referring to the pile coordinate system, where the X-axis follows the pile:
For the Soil:
For the Pile:
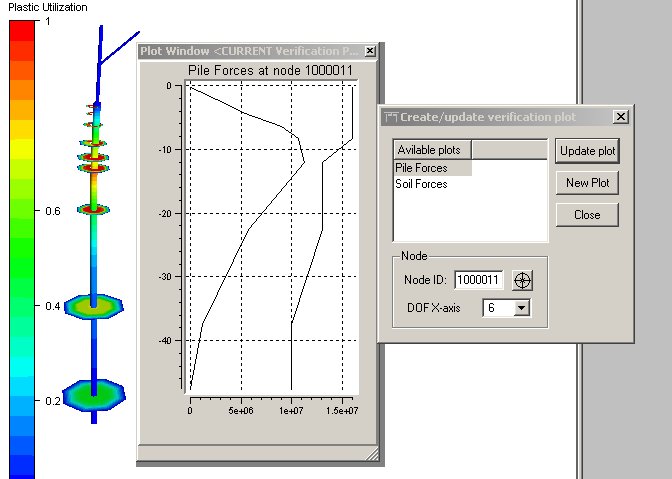
Figure 2 Bending Moment along pile. Capacity Curve and current moment.
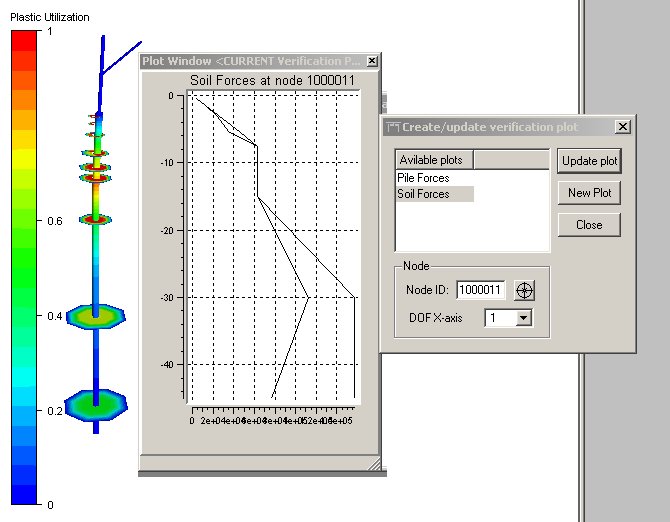
Figure 3 T-Z forces and capacities along the pile length.

Figure 4 T-Z forces and capacities along the pile length. Force Plot is updated according to selected load level
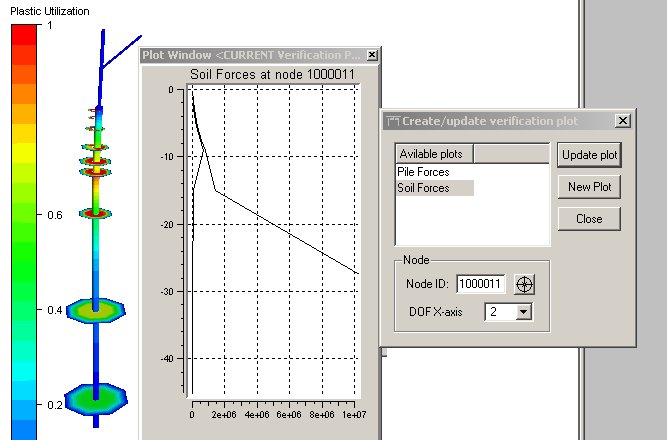
Figure 5 P-Y forces and capacities along the pile length.
For all Images, the "Plastic Utilization" is shown for both the Pile and the Soil. The Depths are presented relative to the Mud Line.